
The University of Columbia, the Institute for Health Metrics and Evaluation (IHME) and the Health Effects Institute (HEI) recently published a special report on global exposure to air pollution and its effect on disease. The IHME is an independent health research center from the University of Washington and the HEI is a non-profit independent research organization that has, since 1980, been promoting / publishing impartial science on the effects of air pollution.
The objective of this report is to build on the Global Burden of Disease Study (GBD), which is the most comprehensive study worldwide that describes causes of mortality, major diseases, injuries and other factors that are a risk to health in a national, regional and global perspective. The latest publication by the GBD in 2015 reported that exposure to PM2.5 is the 5th biggest contributor to mortality and disease globally and accounts for 4.2 million deaths from heart disease, stroke, lung cancer, chronic lung disease and respiratory infections. Their recommendation is to continue tracking and analyzing pollution and PM2.5 in order to better understand how to reduce this burden on the health system and society as a whole.

The State of Global Air report highlights several important messages that we summarize here with some illustrative charts:
- A number of institutions are researching air pollution and its effects on health. WHO estimated that, in 2012, 3 million people died from PM2.5 exposure, GBD says 4.2 million.While there may be discrepancies in the number based on methods of estimation and source of data, all research parties agree that the impact of PM2.5 is substantial and growing in importance.
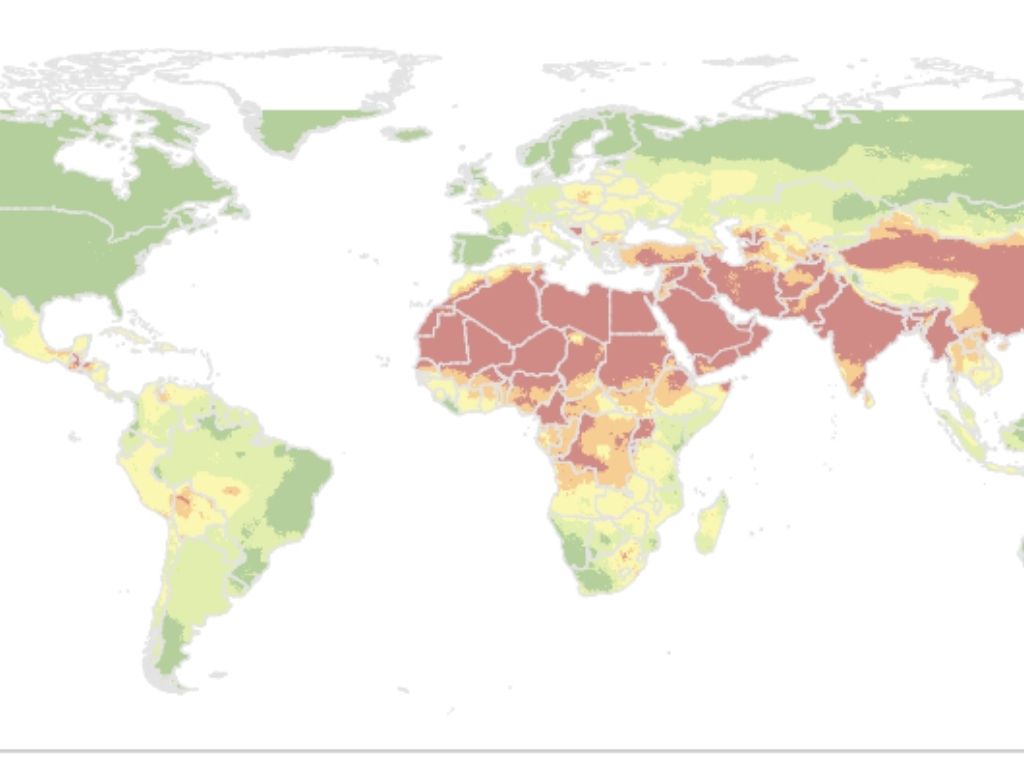
- The most affected regions are Asia and Africa, as seen in the chart here.

- Since 2010, the number of deaths and disease due to PM 2.5 has been increasing rapidly. Interestingly in China, the change escalated between 1990 and 2010 and has now plateaued.
- Bangladesh and India are experiencing the largest increase since 2010, in the order of 50%-60% increase in the 5 years to 2015.
- Disparities among countries have also grown: less-polluted areas are now cleaner, whereas PM concentrations have increased in the most polluted areas. Some of these trends are shown in the chart here.

- In 2015, long term exposure to PM2.5 contributed to 4.2 million deaths costing 103 million years of healthy life with 52% of this happening in China and India. The financial and social cost to society is huge.
- Coal-burning by industry, power plants and home heating creates 40% of PM2.5 exposure as shown in the chart here.

This report is issued yearly building on the GBD reports and making available new data. The 2018 report expects to share successful stories from cities and countries across the world on how they have improved air quality and public health.
In the interim, the most important is to continue collecting data on air quality and making changes in your day-to-day lives to improve the air you breathe.
Air quality data helps us to understand trends and visualize potential solutions. blue aims to help users do just this and we are looking forward to launching our product in the market soon.
If you want to explore the data more in detail, change the comparative countries or just learn more, go to: https://www.stateofglobalair.org/report
Source of information and graphics:
State of Global Air 2017. HEI, 2017. www.stateofglobalair.org. Data source: Global Burden of Disease Study 2015. IHME, 2016. (Accessed 02/27/2017).