Key Features.
Your Insights.
Now, Revealed.
Your Insights.
Now, Revealed.
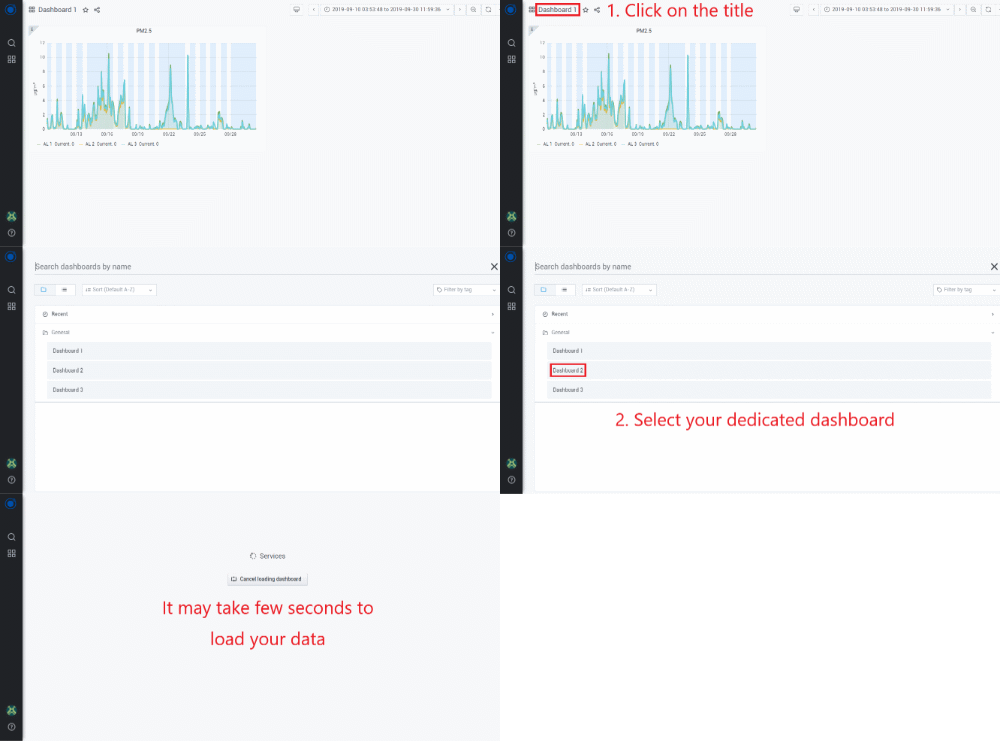
1. Select your dashboard
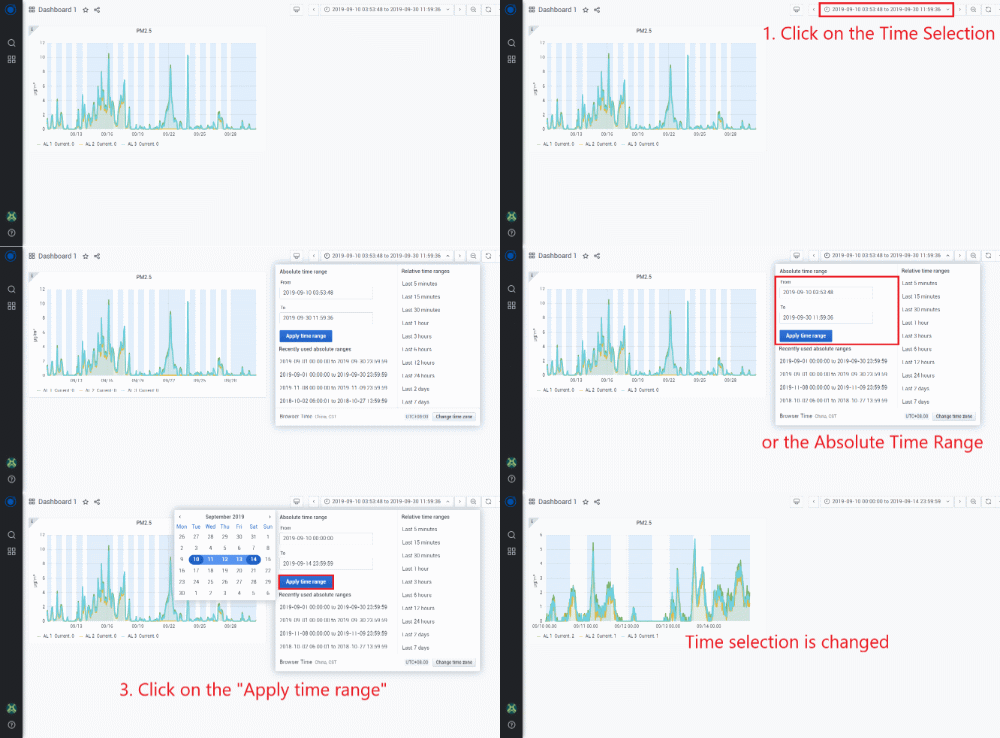
2. Select time frame
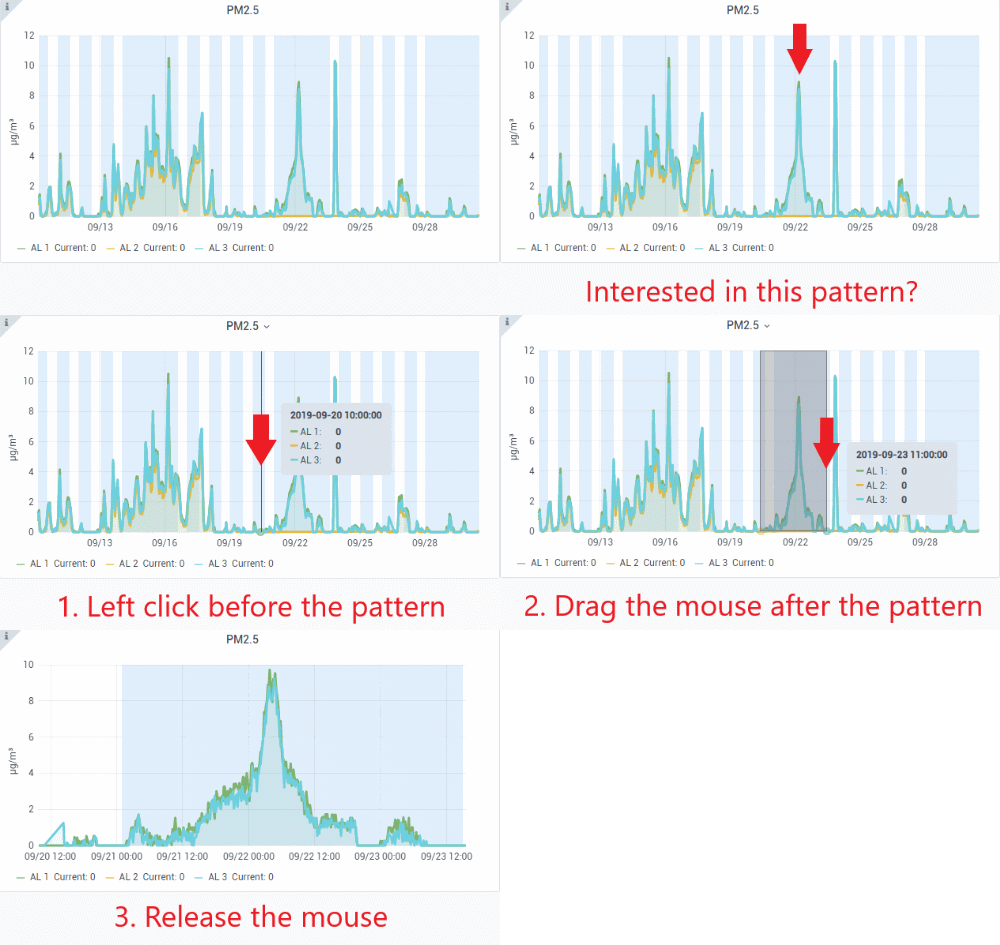
3. Zoom in
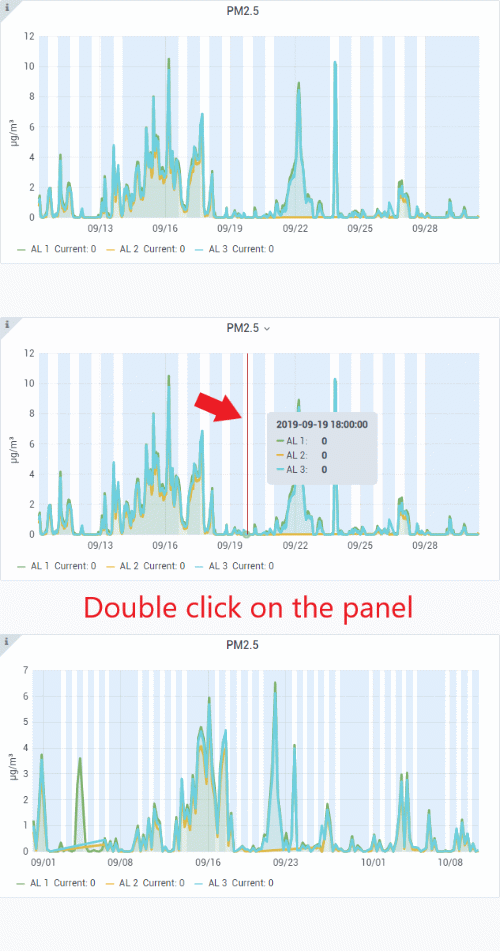
4. Zoom out
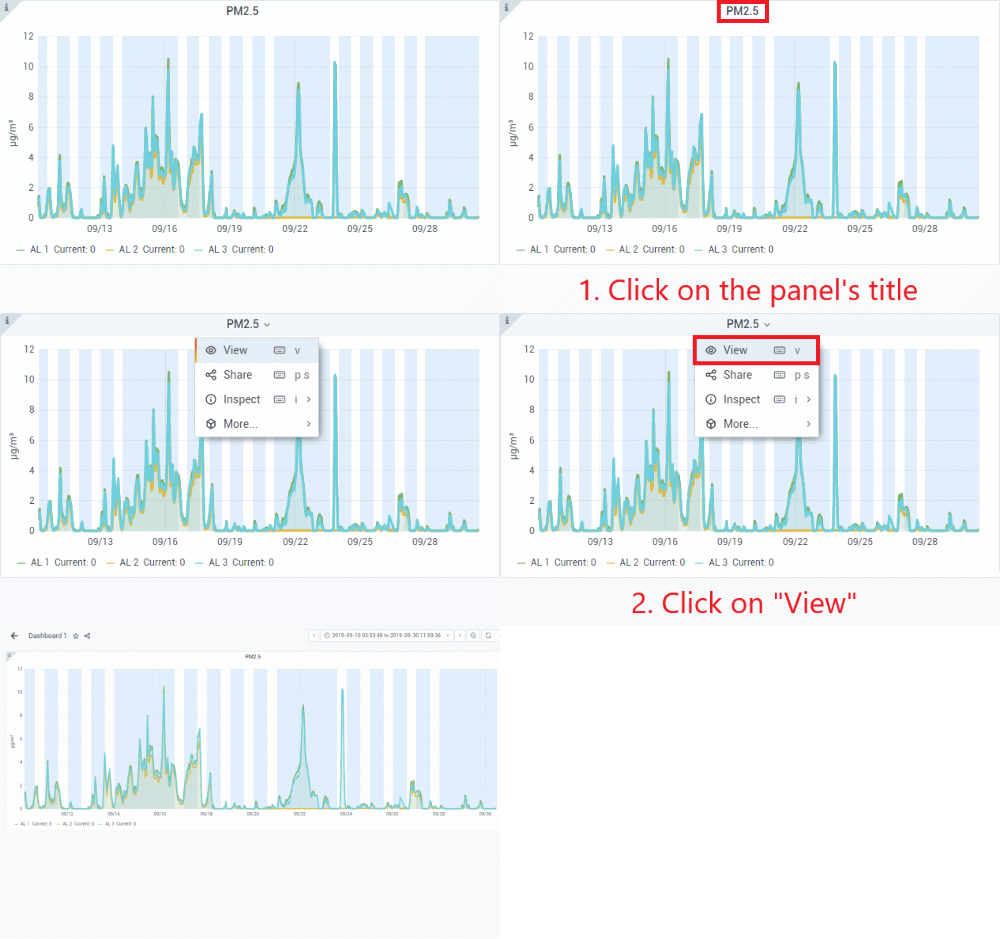
5. Full screen view
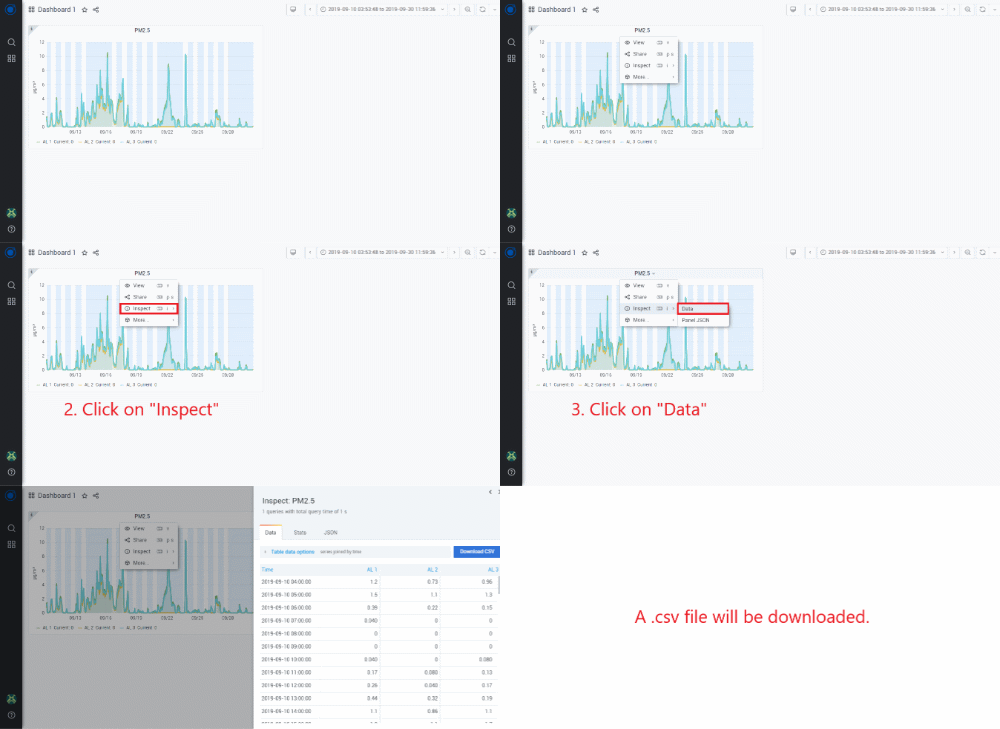
6. Download data
1. Time in download csv file is UTC time
2. Data frequency depends on time selection:
| time Selection | SHOWN Data Frequency |
|---|---|
| up to 40 hours | monitor measurement interval |
| 40 hours to 7 days | 10 minutes |
| 7 days to 40 days | 1 hour |
| 40 days to 250 days | 6 hours |
| 250 days to 1000 days | 24 hours |

