What Is It That We All Call Pollution?

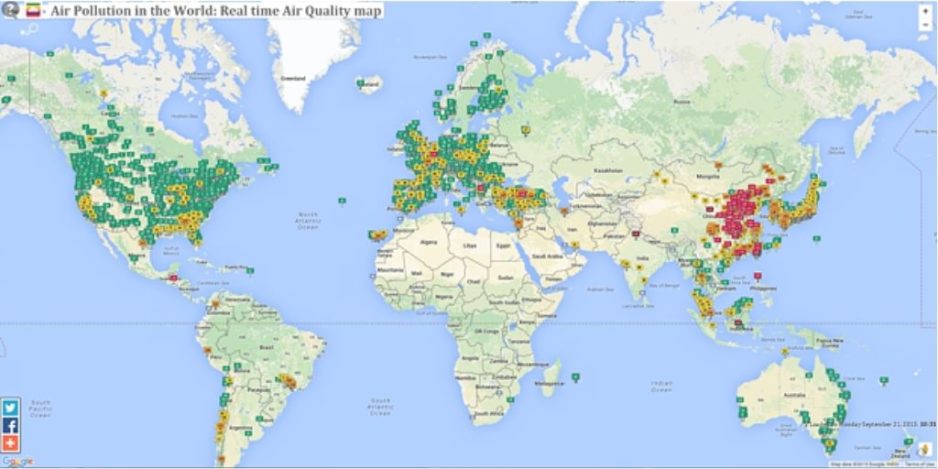
Air pollution is becoming more and more present in the news, in casual conversations, in the promotion of products and in many more instances. However, are we all talking about the same thing? What exactly is it that we all call ‘air pollution’?

Air pollution is a mix of natural and man-made substances in the air we breathe which is harmful to our health, it can be any physical, chemical or biological agent that modifies the natural atmosphere. Most sources of air pollution are man-made from mobile sources such as fuel powered motor vehicles; and stationary sources such as factories, refineries, power plants and forest fires. There are also other indoor sources such as building materials and cleaning products. Air pollution, as we now know is present both outdoor and indoor.

Outdoor air pollution:
  • Fine particles (burning of fossil fuels in energy production, coal and petroleum used in vehicles)
  • Gases (sulphur dioxide, nitrogen oxide, carbon monoxide, chemical vapours and others)
  • Ground-level ozone (smog)
Indoor air pollution:

Gases emanating from:

  • Household products and chemicals, or
  • Building materials such as paint, wood, furniture (asbestos, formaldehyde, lead etc)
  • Allergens such as coackroaches, mold, pollen

The World Health Organization (WHO) in 2005 issued the ‘WHO Air Quality Guidelines’ to offer guidance and limits for the most worrying air pollutants because of their threat to human health, their widespread presence in urban areas and their relevance as precursors for other toxic components: particulate matter (PM10, PM2.5), ozone (O3), nitrogen dioxide (NO2) and sulphur dioxide (SO2).

Particulate Matter

Is a mix of solid and liquid (organic or inorganic) particles suspended in the air. It is the pollutant that affects most people and is generally composed by sulphate, nitrates, ammonia, sodium chloride, black carbon, mineral dust and water.

Ozone (O3)

Ground-level Ozone is a major component of smog, formed by the reaction of sunlight with nitrogen oxides (NOX) and volatile organic compounds (VOCs).

Nitrogen Dioxide (NO2)

NO2 is mostly the result of emissions during the combustion process (power generation, heating and engines). It is in fact, a source of nitrate aerosols that form PM2.5.

Sulphur Dioxide (SO2)

SO2 is produced from fossil fuel burning for domestic use, power generation or motor vehicles

Other components generally referred to when talking about air pollution are carbon monoxide (CO), carbon dioxide (CO2) and volatile organic compounds (VOCs), which has greater relevance when talking about indoor air pollution, although also present outdoors.

VOCs are a collection of toxic gases from solids or liquids, that are found in higher concentrations indoors (up to ten times higher). Thousands of products used indoors as construction materials, paints, varnishes, cleaning agents, activities like cooking and many more, are the source of VOCs while being used and while stored. (6) Safe levels / guidelines for exposure to VOCs are not known,, but common sense rules are that they should be kept at low levels to avoid or reduce their negative health effects, which have been well documented.

CO and CO2 are not considered as VOCs. They are both odorless, tasteless and harmful to human health but have clear differences – CO2 occurs naturally in the atmosphere and we can tolerate it in small amounts, whereas CO can cause problems even in low concentrations and is flammable.

WHO AIR QUALITY GUIDELINES
  • PM5
    10 μg/m3 annual mean
    25 μg/m3 24-hour mean
  • PM10
    20 μg/m3 annual mean
    50 μg/m3 24-hour mean
  • NO2
    40 μg/m3 annual mean
    200 μg/m3 1-hour mean
  • SO2
    20 μg/m3 24-hour mean
    500 μg/m3 10-minute mean
  • O3 
    100 μg/m3 8-hour mean
    WHO issued these guidelines as a global standard for environmental quality. Each country can adopt the guideline at its maximum standard or take interim standards that better reflect their national balance between health risks, economic decisions, technological capacities and other political and social factors.

Sources:

NIH – Air Pollution and Your Health
EPA – Pollutants and Sources
WHO – Air Pollution
WHO – WHO Challenges World to Improve Air Quality
WHO – WHO Guideline for Particulate Matter, Sulphur, Ozone…
EPA – Volatile Organic Compounds’ Impact on Indoor Air Quality

Indoor and outdoor air pollution: a silent threat

The World Health Organisation estimates that 3.7 million deaths are the result of outdoor air pollution, and 4.3 million deaths are attributable to indoor air pollution. Sadly, our region (Western Pacific) has the highest number of casualties due to air pollution.

Air pollution control is not entirely in the hands of individuals, but controlling exposure to air pollution is.

Follow these WHO links for additional information:

Children and Air Quality in Asia

In October 2016, United Nations Children’s Fund (UNICEF) published the report “Clear the Air for Children” exposing the magnitude of the danger that air pollution poses for children.

The report shows that, in Asia alone, 300 million children live in areas with toxic levels of outdoor air pollution six times greater than the WHO set standard of 10m/m3 with 1.22 billion children in Asia living in areas that simply exceed WHO standards. Even more alarming, is that these estimates only account for exposure to outdoor air and do not include indoor air pollution. Moreover, UNICEF estimates that every year 600,000 children under-five years old die from diseases caused or aggravated by air pollution and the Organisation for Economic Co-operation and Development (OECD) says these estimates could be 50% higher by 2050.

The reason children have a higher exposure when compared to adults is because they breathe twice as fast and their air intake volume is more relative to their body weight. They are vulnerable and exposed to air pollution before they are even born by changes in the placental function.  Air pollution can harm their bodies by affecting their developing organs, particularly their respiratory system and their brain. It has also been shown that air pollution can cause cognitive and physical development delays.  These negative effects are carried over into their adulthood. Studies have shown that children living in highly polluted areas can have reduced lung capacity by up to 20% and are more likely to have respiratory problems either in childhood or later in life.

In Asia, the situation is bleak. Emissions from factories and vehicles are high and with poor regulation, waste is often burnt, energy is mostly coal-fueled and many households burn biomass for cooking. All combined, the outdoor and indoor air quality tends to be among the worst across the world.

UNICEF comes to four conclusions to protect children from air pollution:
  1. Increase efforts to reduce air pollution and therefore reduce disease caused by air pollution as well as reduce the threat to children’s health and development. This includes better management of energy generation, waste management, public transportation, technology on vehicle and factory emissions and naturally more information and knowledge.
  2. Minimize children’s exposure at home, in schools and in those areas where they spend most time.
  3. Improve children’s overall health to reduce health complications from exposure to air pollution.
  4. Improve monitoring of air pollution and its link with children’s health.
What can individuals and families do?
  • Ensure good ventilation;
  • Clean cook stoves;
  • Prevent exposure to tobacco smoke;
  • Increase knowledge on how to protect themselves; and,
  • Better monitor air pollution to better understand time and characteristics of risk.
More air quality monitoring, and more knowledge on air pollution is essential to protect our children!

Source:

NIHIn Utero Fine Particle Air Pollution and Placental Expression of Genes in the Brain-Derived Neurotrophic Factor Signaling Pathway: An ENVIRONAGE Birth Cohort Study.

Am I Exposed to Air Pollution?

But how is our exposure to air pollution measured?

The WHO model was developed together with the University of Bath, United Kingdom and is based on data from more than 3,000 locations with ground station monitors which represent about 40% of the world’s urban population. It also includes satellite measurements and air transport models to give an annual average exposure to particulate matter (PM2.5), which are the tiny particles that penetrate deep into the body and create the greatest harm.

Another source of air quality information that is commonly used across the world is the AirNow or AQICN Apps, Facebook and webpage. This information comes from the Environmental Protection Agencies of 600 major cities in 70 countries. The information from 9,000 stations is collected and reported on an hourly basis in real time. The readings are displayed in the EPA AQI standard index and only uses PM2.5 and PM10 readings.

Is this data accurate to assess my personal exposure?

Research has shown that population exposure from fixed-site monitors do not show a clear picture of daily exposure at the individual level. In fact when comparing personal exposure measurements and ambient monitoring, there are significant differences and some studies have shown that the major variance comes from accounting for air quality during commuting to and from work, school or play. A recent study by the Massachussetts Institute of Technology (MIT) suggests that data collected through mobile phone usage to determine ‘activity patterns’ (areas most transited by people) can be linked to the traditional static air quality monitoring to give a more precise measurement of exposure to air pollution.However, this will also depend on the number of air monitoring stations in the city where you live and how close they are to your area of commute or to the area where you work, how long you spend indoors and the quality of air indoors. All in all, the current system of air quality monitors provides useful information for policy matter and to have an indication of the general air quality, but it fails to provide any given individual with an accurate account of his own personal exposure to air pollution.

There is no doubt that the most useful measure of your personal exposure is a portable air quality monitor, that can give you personalised, real-time, accurate information of your own daily exposure accounting for the quality of the air indoors as well as the outdoor air you are exposed to in your daily routine.

Taking care of your health starts by owning the data of those environmental threats that can negatively affect your health.
This is why we at meo believe that we can make a difference in your life. 

In the meantime, get informed:

  • To know the annual PM2.5 levels in the city where you live visit: www.breathelife2030.org
  • To know hourly air quality values on US EPA AQI standard visit: www.aqicn.org or download the App
  • Look for local options to access data that better represents your personal exposure.

Sources:
MIT News – Measuring exposure to pollution
WHO – WHO releases country estimates on air pollution exposure and health impact
AQICN – World-wide Air Quality Monitoring Data Coverage

Air Pollution Effects Beyond Health

Interest and research focus on the effects of air pollution is increasing, and now spreading beyond the realm of health. The World Bank and the Institute for Health Metrics and Evaluation (IHME) published in September 2016 the report: The Cost of Air Pollution, Strengthening the Economic Case for Action. The objective of the report is to show the economic meaning of the health effects of pollution, beyond the purely health-related cost.

Since the 1990’s researchers have looked into the link between air pollution and chronic and even fatal health outcomes. The risk has been increasing with the burgeoning of urban life in developing countries and the need for rapid economic development in emerging economies. However, the use of wood, charcoal, dung and coal for heating and cooking in many rural areas of Africa, Asia and Latin America also contributes remarkably to the health risk from air pollution. The World Health Organization has recently said that 9 out of 10 people in the world are affected by air pollution.

According to a recent report by the Organization for Economic Cooperation and Development (OECD), healthcare costs related to air pollution are projected to increase from the current 21 billion USD in 2015 to 176billion USD in 2060 (using constant 2010 USD values) with an annual projected number of lost working days of 3.7 billion globally (currently 1.2 billion).

What is interesting in the latest report from the World Bank is that it shows the effects of pollution on development. Beyond the health effects and the health costs, there is naturally a reduction in the quality of life, a reduction of income, reduced productivity and innovation, degradation of natural ecosystems, crop yields, perpetuation of inequalities and even decreased economic competitiveness to attract top talent. However, taking action in favor of clean air is costly and often seen as a brake on economic development in low and middle-income countries. The World Bank decided to further research on this matter to strike a balance between the gains of rapid development with no consideration to air pollution, and a more conscious development that understands the economic losses of increased air pollution. In fact the US Office of Management and Budget has acknowledged that the rules issued by the US Environmental Protection Agency (EPA) to improve air quality are the most economically beneficial federal regulations.

Key findings of the study show that it is estimated that since 1990 air pollution has been the fourth highest modifiable cause of premature death. In 2013 air pollution had a global cost of US$225 billion from lost labor income or US$5.11 trillion of losses in welfare, which is equivalent to the GDP of India, Canada and Mexico combined. Welfare losses in Asia (South, East and the Pacific) were equivalent to 7.4% of the regional GDP. Lost income in South Asia was of the magnitude of 66 billion (nearly 1% GDP). From 1990 to 2013 premature mortality attributable to PM2.5 increased by 30% while global welfare losses increased by 63% and labor income losses by 40% with a larger effect on men than women.

As more evidence on the economic effects of air pollution emerges, countries should be urged to measure their pollution at a wider scale in order to implement adequate policies.

Sources:

The World Bank – The Cost of Air Pollution : Strengthening the Economic Case for Action

OECD – The Economic Consequences of Outdoor Air Pollution