Are you pregnant? We’ve got you covered! Tips to protect your bump from Air Pollution

Air pollution is ubiquitous and our desire to have offspring is natural….well at least for some of us! Today we want to bring to you a few facts on what is known about exposure to air pollution during pregnancy for you and your bump.  Here are some useful and easy to follow safety tips.

Let’s start with the facts:

Research has shown that prenatal exposure to pollutants can increase the risk of low birth weight and preterm delivery, which contributes to infant mortality and developmental disabilities. We are usually concerned about outdoor air pollution: ozone, particulate matter etc but other pollutants of concern that we should always keep in mind are those mostly present indoors, such as household cleaners, fumes from paint and carbon monoxide in addition to particulate matter that is present indoors.

Some research has shown that particulate matter affects the fetal development because it alters the intrauterine environment. This ‘early-life’ stress is a contributor to conditions that will increase the risk of cardiovascular disease, cognitive function, diabetes, obesity and problems in the nervous system later in life.

“Healthy pregnancies in women result in healthy children. Healthy children make healthy adults, societies and nations.” Dr Sherin Devaskar, Mattel Executive Endowed Chair of the department of pediatrics at Mattel Children’s Hospital UCLA

Source:

Breathe Life 2030 – Air Pollution and Pregnancy (pdf)

Policies: the debated carbon tax

Following COP21 and the Paris Agreement governments representing 96% of global greenhouse emissions (GHG) and 98% of the world’s population committed to reduce their emissions. They now need to ensure businesses and individuals use energy with less GHG emissions.  

Currently there are two market-based options to encourage lower emissions based on higher costs for polluting industries: the carbon tax and cap-and-trade schemes (ETS). The carbon tax is a levy on the production, distribution and use of fossil fuels based on the amount of carbon emitted in that specific process, which is then translated into a tax on electricity, natural gas or oil. This system is built to encourage businesses and individuals to consume less energy or do it more efficiently, the more electricity they use the higher its cost. Therefore, the carbon tax policy encourages the use of less electricity by improving efficiency and at the same time it also makes green energy more price-competitive.

How do governments price carbon?

They put together all the costs caused by carbon emissions, such as healthcare costs, agricultural costs and others; and they tie them to the carbon used per year. It makes those responsible for the emission, responsible for the external costs of that emission too, and signals the need to reduce emissions or pay for it.

Technically, we have advanced considerably in carbon tax policies. The Paris Agreement has been a stepping stone to increase carbon pricing initiatives across the globe, in its Article 6 the Agreement provides a basis to facilitate carbon pricing. And according to the World Bank, 40 countries and more than 20 cities, states and provinces use carbon pricing –they account for 13% of annual global greenhouse emissions. Now 100 countries additional –accounting for 58% of global GHG- are planning or considering carbon pricing policies. Many of these initiatives are at a very early stage, but nonetheless they have taken that positive step which can then be the beginning of a more aggressive pricing strategy. The most promising advance for this coming year is that China is expected to implement its ETS. This would be the largest increase of GHG covered by carbon pricing.

Summary map of existing, emerging and potential regional, national and subnational carbon pricing initiatives (ETS and tax) from World Bank. State and Trends of Carbon Pricing 2016 (October)

However, the reality of many regions of the world and notably of Asia shows just how challenging this can be and why these policy efforts are sometimes not felt in the actual air we breathe.

In Asia, change could translate to significantly lower global carbon emissions. Because Asia is the largest emitter – 33% of the global emissions are generated in Asia where China alone uses more coal than the rest of the world combined, any successful implementation of policies can have a huge impact globally. However, the challenge is big. India, Indonesia, Pakistan, Bangladesh and other Asian countries have a growing demand for electricity to meet their developmental needs -expected to double by 2030- and plans for this expansion rely heavily on coal fueled electricity. Nonetheless, China has a great interest to change their carbon emission trends and has set the target to peak carbon emissions by 2030 and increasing the non-fossil fuel to 20% by 2030. Similarly, India, Vietnam and Bangladesh are actively working to increase the use of renewables in the energy mix. The question is how can the solar energy or wind energy projects in all these countries be scaled-up to represent a larger portion of the national energy mix.

What can businesses and individuals do?

A quote by an American Author seems relevant at this point.

“I am only one, but I am one. I cannot do everything, but I can do something. And I will not let what I cannot do interfere with what I can do.” 
― Edward Everett Hale

Strive for energy efficiency because you can!

Sources:

HowStuffWorks – How Carbon Tax Works
The World Bank – Pricing Carbon
The World Bank – Asia Can Help Lead the Way to Climate Change
The World Bank – State and Trends of Carbon Pricing 2016
Ministry for the Environment – Ministerial Declaration on Carbon Markets
Climate Central – The West’s Largest Coal Plant May Close.It’s a Big Deal.

State of Global Air 2017

The University of Columbia, the Institute for Health Metrics and Evaluation (IHME) and the Health Effects Institute (HEI) recently published a special report on global exposure to air pollution and its effect on disease. The IHME is an independent health research center from the University of Washington and the HEI is a non-profit independent research organization that has, since 1980, been promoting / publishing  impartial science on the effects of air pollution.

The objective of this report is to build on the Global Burden of Disease Study (GBD), which is the most comprehensive study worldwide that describes causes of mortality, major diseases, injuries and other factors that are a risk to health in a national, regional and global perspective.  The latest publication by the GBD in 2015 reported that exposure to PM2.5 is the 5th biggest contributor to mortality and disease globally and accounts for 4.2 million deaths from heart disease, stroke, lung cancer, chronic lung disease and respiratory infections. Their recommendation is to continue tracking and analyzing pollution and PM2.5 in order to better understand how to reduce this burden on the health system and society as a whole.

The State of Global Air report highlights several important messages that we summarize here with some illustrative charts:

  • A number of institutions are researching air pollution and its effects on health. WHO estimated that, in 2012, 3 million people died from PM2.5 exposure, GBD says 4.2 million.While there may be discrepancies in the number based on methods of estimation and source of data, all research parties agree that the impact of PM2.5 is substantial and growing in importance.
  • The most affected regions are Asia and Africa, as seen in the chart here.
  • Since 2010, the number of deaths and disease due to PM 2.5 has been increasing rapidly. Interestingly in China, the change escalated between 1990 and 2010 and has now plateaued.
  • Bangladesh and India are experiencing the largest increase since 2010, in the order of 50%-60% increase in the 5 years to 2015.
  • Disparities among countries have also grown: less-polluted areas are now cleaner, whereas PM concentrations have increased in the most polluted areas. Some of these trends are shown in the chart here.
  • In 2015, long term exposure to PM2.5 contributed to 4.2 million deaths costing 103 million years of healthy life with 52% of this happening in China and India. The financial and social cost to society is huge.
  • Coal-burning by industry, power plants and home heating creates 40% of PM2.5 exposure as shown in the chart here.

This report is issued yearly building on the GBD reports and making available new data. The 2018 report expects to share successful stories from cities and countries across the world on how they have improved air quality and public health.

In the interim, the most important is to continue collecting data on air quality and making changes in your day-to-day lives to improve the air you breathe.

Air quality data helps us to understand trends and visualize potential solutions. blue aims to help users do just this and we are looking forward to launching our product in the market soon.

If you want to explore the data more in detail, change the comparative countries or just learn more, go to: https://www.stateofglobalair.org/report

Source of information and graphics:
State of Global Air 2017. HEI, 2017. www.stateofglobalair.org. Data source: Global Burden of Disease Study 2015. IHME, 2016. (Accessed 02/27/2017).

Asia’s latest eclectic response to carbon emissions

Asia is at a crossroads between economic development and environmental protection on many fronts. Today we would like to highlight the two extreme positions that coexist in Asia, from a new South Korean president that has ensured the closure of coal fired plants to a plan to open 10 new such plants in Myanmar, already one of the most polluted countries in the world!

The Asian continent accounts for approximately 41% of carbon emissions, even if a per capita basis, carbon emissions are still low due to its large population size. What is evident from this is the potential for the current percentage of carbon emissions to increase dramatically with the expected economic development in the Region.

While some actions are being taken to clean the air…

Only in the last month we’ve seen news showing the disparity in carbon policies in the region. On one hand, China is rolling out the largest investment in solar and wind power in order to reduce coal powered electricity and has vowed to reduce the steel production capacity (a highly polluting industry) by 50 million tonnes. Furthermore, in March, China announced the closure of 103 coal power plants. This will have a major impact on improving regional air quality.

In this same line, Moon Jae-in – South Korea’s new president, started on the front foot fighting air pollution and ordered the shutdown of ten old coal power plants to address public protests. They will be temporarily shut down and by the end of his term, they are expected to be permanently shut down.

…other actions are being taken to increase power generation

On the other side, there are countries like Myanmar which have made public their plans to open 10 new coal-fired plants. The air quality in Myanmar is among the dirtiest in the world with six cities with higher counts of PM10 than Beijing! It is true that the country is currently only providing energy to less than 30% of the population and increased power is required to attract foreign investment, but it is also true that there are plans to build a hydroelectric dam to harness Irrawady’s river power, power which will be sold almost entirely to China (90%).

Another example of this situation is Bangladesh, which is constructing a power plant on the edge of the world’s largest mangrove: the Sundarbans. This project threatens the UNESCO-protected mangroves that are a barrier against storms and cyclones and has the potential to severely affect human health from air pollution, water pollution and storm emergencies. Campaigners have protested heavily to halt the construction.

Regional solutions?

Participants in the recent Belt&Road initiative have called on the need to implement in full the Paris Agreement. However, Asia faces enormous challenges and opportunities that would most benefit from increased regional co-operation in this initiative.

Increased knowledge about air pollution and its health consequences have sparked actions in the region to reduce the number of existing coal-fired plants. The more we talk about this, the more we can put pressure on governments to improve air quality in Asia.

Sources:
The Nation – Myanmar coal plant growth could kill 280,000

IOPscience – Regional carbon fluxes from land use and land cover change in Asia, 1980–2009
The Citizen – Bangladesh coal plant could cause 6,000 early deaths
Our World (by United Nations University – Carbon Governance in Asia: Bridging Scales and Disciplines
Greenpeace – Belt and Road participants call for full implementation of Paris Agreement

FINANCIAL TIMES – South Korea’s new president cracks down on air pollution
National Geographic – China’s Surprising Solutions to Clear Killer Air

Air’volution: cities improving air quality!

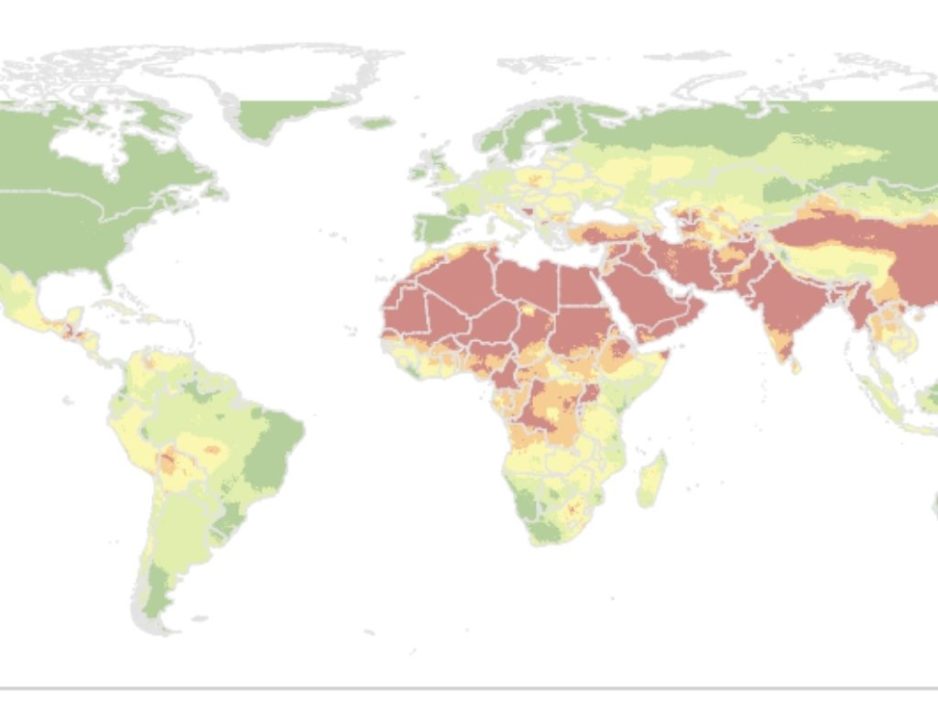
We know for sure that city dwellers are highly affected by worsening air quality across the world and the majority of deaths caused by air pollution occur in cities. In the past ten years, cities have been working together as part of the group C40Cities to find solutions to protect their citizens. The Mayors of the cities that are part of this group have come up with some innovative proposals to push an Air’Volution that stems pollution in the cities. The end of March saw the announcement of bold plans to address locally created air pollution.

The C40Cities, launched in 2005, is a group created and led by cities that connects 90+ cities across 50+countries, representing 650+ million people and one quarter of the global economy. The group recognizes that cities generate most of the world’s carbon emissions and house almost 60% of the global population, hence the importance of their stance in transforming the systems that create the most carbon emissions: transport, building and waste.

What is the Air’volution?

It’s the collection of actions taken by cities to address air pollution and control vehicle emissions. Remember what started as a VW (Volkswagen) scandal? There is now a list of car manufacturers that have been found to manipulate the tests of car emissions. Not to mention that we now know the real polluting nature of diesel cars, even the EURO 6 diesel engines releases more fine particulate matter than heavy duty trucks. Such as:

  • Emissions on the road have been proven to be 15 times greater than emissions in laboratory conditions. Paris and London are working on creating a scheme to score new cars based on their real-world emissions and air quality impact, rather than a laboratory measure. All data is expected to be released by end 2017 so that consumers will be able to know the score for each car model. Seoul, Madrid, Mexico City, Milan, Moscow, Oslo and Tokyo and other cities have committed to work in the development of a global scoring system.

“For too long, some vehicle manufacturers have been able to hide behind inconsistent regulation and consumer uncertainty about the damage their cars are causing,” said Mayor of Paris and C40 Chair, Anne Hidalgo. “This announcement is a wake-up call to car companies that they need to act now. Citizens of Paris and cities around the world demand clean air to breathe and this new scoring scheme will be key to helping achieve that.  I am pleased that Paris, the city of the Climate Agreement, is working with London and Seoul to support this project.”

“This scheme is also a fantastic example of how big cities around the world can pool their expertise and their influence to encourage big industry to clean up its act. The toxicity of the air in London and many other big cities is an outrage, and schemes of the type we are introducing in London and Paris have the potential to make a massive difference to the quality of the air we all breathe.”

Other measures include:

Cities implementing low-emission zones: London has proposed to introduce an Ultra Low Emission Zone (ULEZ) in central London, where cars will have to meet the minimum emission requirements or pay a daily fine (£10). In Paris, vehicles are restricted access for the most polluting vehicles, through the use of Crit’Air stickers. And Seoul has recently designated a Green Transport Promotion Zone that restricts old diesel vehicles and construction equipment, the objective is to cut carbon emissions from vehicles by 40% and vehicle demand by 30%.

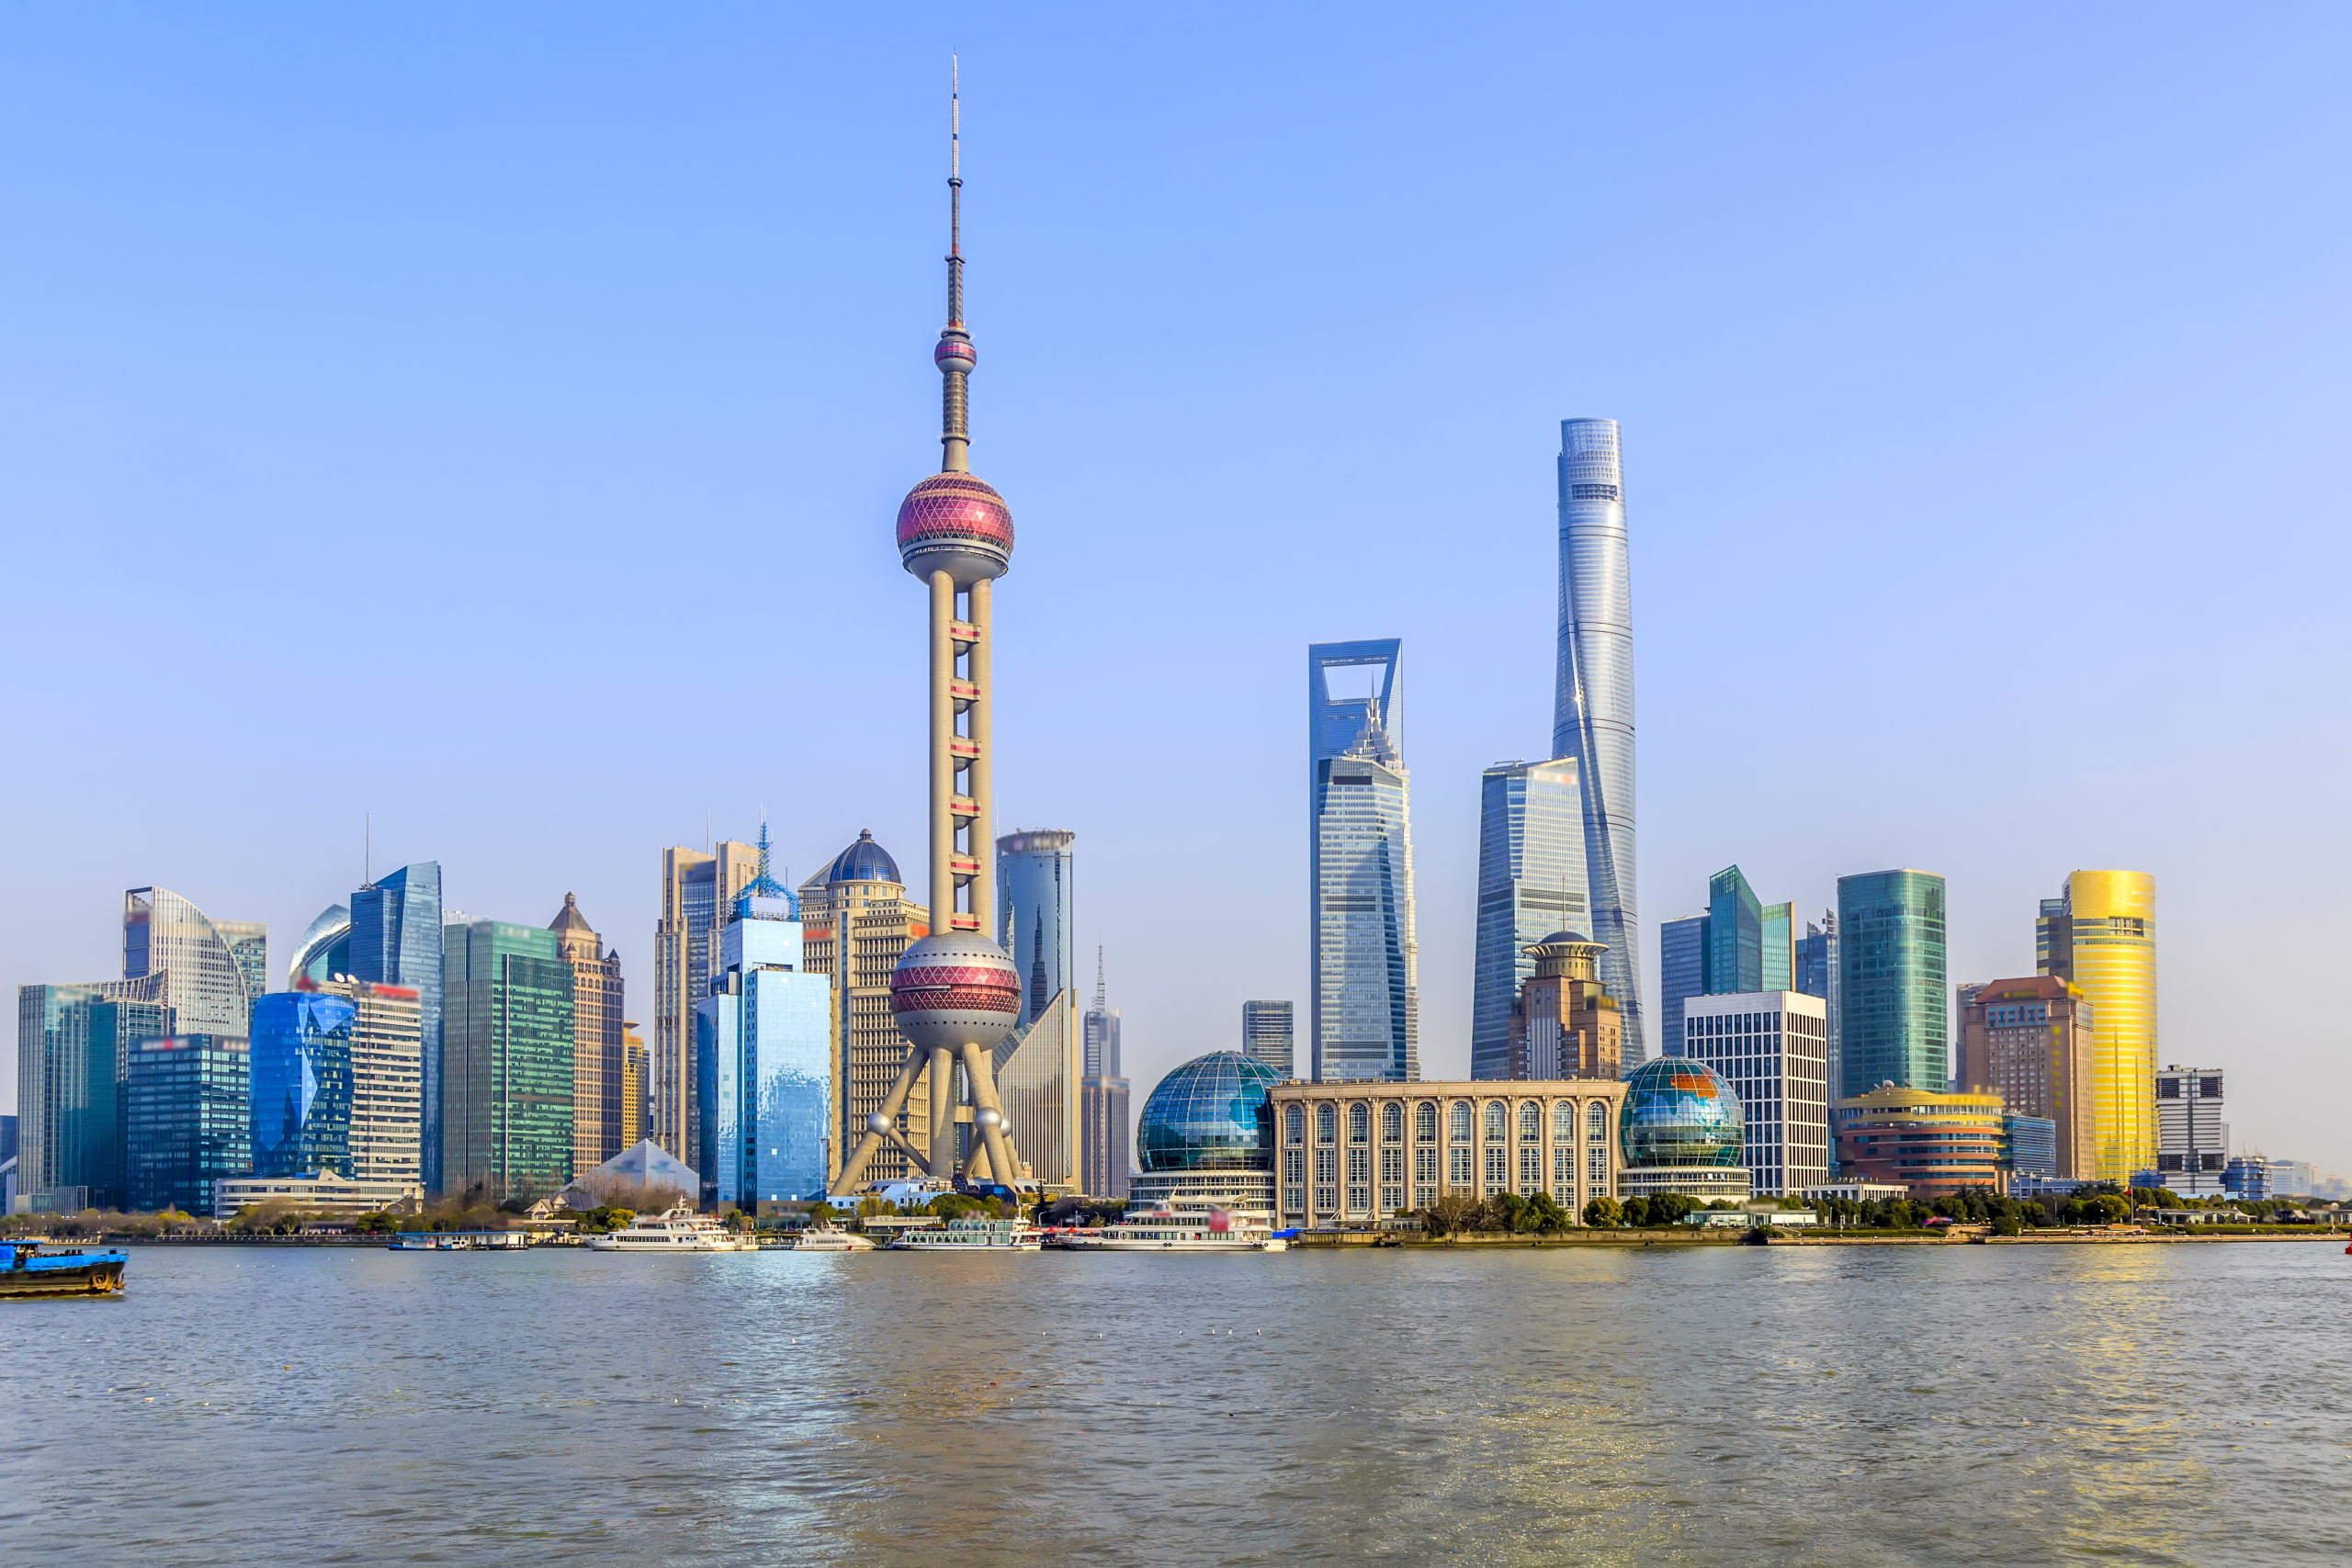
A number of Asian cities are part of the C40Cities: Auckland, Bangaluru, Bangkok, Beijing, Chengdu, Chennai, Delhi, Dalian, Dhaka, Guangzhou, Hanoi, Ho Chi Minh, Hong Kong, Jaipur, Jakarta, Kolkata, Mumbi, Nanjing, Singapore, Shenzen, Shanghai, Seoul, Sydney, Yokohama, Chennai, Mumbai, Tokyo and Wuhan.  Most of these cities need to learn from experiences from other cities in reducing vehicles emissions.

We need to better understand air pollution patterns in our cities to make the most of these policies. Deployment of air quality monitors across the cities is the first step!

Sources:
C40 CITIES – Air’volution
C40 CITIES – Press Release: Mayors of Paris and London Announce Car Scoring System to Slash Air Pollution on City Streets
The International Council on Clean Transportation – First look: Results of the German transport ministry’s post-VW vehicle testing

Air Quality Policy in HK

Beyond the constant air pollution news and our daily experience with pollution, how much do we know about air quality in our Asian cities? And do we know what the local governments are doing to improve air quality?

Today we will take a look at the situation in Hong Kong. Pollution in HK comes from local street-level pollution caused by vehicles and regional smog caused by motor vehicles, marine vessels, industry and power plants both in Hong Kong and the Pearl River Delta region.

What is the Government doing?

The Government has an Air Pollution Control Ordinance and a Clean Air Plan where the objective is to achieve ‘reasonable and practicable air quality to safeguard the health of the population’. Strategies include controlling emissions from motor vehicles, marine vessels, power plants and industry and coordination with the Guangdong Provincial Authorities to implement a joint plan. Strategies are based on the Air Quality Objectives (AQO) set in 2014 and are a combination of WHO’s ultimate Air Quality Guideline (AQG)  and interim targets. In the table below we can see a comparison between WHO AQG and HK AQO with regards to PM10 and PM2.5.

The Actions

What is the current situation like?

The Clean Air Network HK has recently released a report based on 2016 data where they found that HK AQO haven’t been met in the past 3 years and in fact is usually twice the WHO recommended level. Moreover, on a daily basis there is a variation of readings in which peak times air quality is 2.6 times worse than off-peak times, suggesting vehicles are having a higher role in damaging local air quality.

 “The growth of vehicles number has gone uncontrollable and offset some of the effort made by the government, especially to reduce NO2.” The CEO of Clean Air Network, Patrick Fung, said.  “The next term of government should look at this imminent issue as top of the agenda. Traffic has been a daily headache to all Hong Kong people, and is an impediment to the improvement of air quality, public health and other living qualities.”

According to the Hedley Environmental Index of HKU School of Public Health, the air pollution in 2016 caused 1,686 premature deaths, 21.6 billion direct economic loss and 2.65 million additional doctor visits.

Overall, we need to have more information on air quality and a broader coverage of monitoring stations in order to better understand the situation in the city and have targeted local policies!

Sources:
Clean Air Network – How bad is Hong Kong air now
HKSAR Environment Bureau – A Clean Air Plan
Environmental Protection Department – Air Quality Objectives Website
Environmental Protection Department – Compliance Status of Air Quality Objectives

Am I Exposed to Air Pollution?

But how is our exposure to air pollution measured?

The WHO model was developed together with the University of Bath, United Kingdom and is based on data from more than 3,000 locations with ground station monitors which represent about 40% of the world’s urban population. It also includes satellite measurements and air transport models to give an annual average exposure to particulate matter (PM2.5), which are the tiny particles that penetrate deep into the body and create the greatest harm.

Another source of air quality information that is commonly used across the world is the AirNow or AQICN Apps, Facebook and webpage. This information comes from the Environmental Protection Agencies of 600 major cities in 70 countries. The information from 9,000 stations is collected and reported on an hourly basis in real time. The readings are displayed in the EPA AQI standard index and only uses PM2.5 and PM10 readings.

Is this data accurate to assess my personal exposure?

Research has shown that population exposure from fixed-site monitors do not show a clear picture of daily exposure at the individual level. In fact when comparing personal exposure measurements and ambient monitoring, there are significant differences and some studies have shown that the major variance comes from accounting for air quality during commuting to and from work, school or play. A recent study by the Massachussetts Institute of Technology (MIT) suggests that data collected through mobile phone usage to determine ‘activity patterns’ (areas most transited by people) can be linked to the traditional static air quality monitoring to give a more precise measurement of exposure to air pollution.However, this will also depend on the number of air monitoring stations in the city where you live and how close they are to your area of commute or to the area where you work, how long you spend indoors and the quality of air indoors. All in all, the current system of air quality monitors provides useful information for policy matter and to have an indication of the general air quality, but it fails to provide any given individual with an accurate account of his own personal exposure to air pollution.

There is no doubt that the most useful measure of your personal exposure is a portable air quality monitor, that can give you personalised, real-time, accurate information of your own daily exposure accounting for the quality of the air indoors as well as the outdoor air you are exposed to in your daily routine.

Taking care of your health starts by owning the data of those environmental threats that can negatively affect your health.
This is why we at meo believe that we can make a difference in your life. 

In the meantime, get informed:

  • To know the annual PM2.5 levels in the city where you live visit: www.breathelife2030.org
  • To know hourly air quality values on US EPA AQI standard visit: www.aqicn.org or download the App
  • Look for local options to access data that better represents your personal exposure.

Sources:
MIT News – Measuring exposure to pollution
WHO – WHO releases country estimates on air pollution exposure and health impact
AQICN – World-wide Air Quality Monitoring Data Coverage

TIPS: How To Protect Your Skin From Polluted Air

In Asia, air pollution is a daily fact, we tend to look at its level on a daily basis. Many decide not to exercise outdoor when pollution is high or simply to avoid going outdoors to protect their lungs. However, Particulate Matter accumulates in our pores throughout the day and we seldom worry about our skin exposure to air pollution.

In the past decades we have learnt a lot to protect our skin from the sun and its UV light. However, our skin is also vulnerable to air pollution and the public is slowly starting to acknowledge it. Protecting our skin is important because it is the barrier to keep organisms and detrimental chemicals out of our body. If the skin is damaged, we are more prone to allergies and reactions and diseases.

Since 1998, L’Oreal started to research the effect of air pollution on skin. The latest research was published in the International Journal of Cosmetic Science and included results from Mexico and Shanghai. It was found that pollutants such as ozone, car exhaust and industrial gases all increase oxidized proteins, increase sebum production, deplete the skin of vitamin E – which prevents skin damage, and squalene – a lipid that protects the skin from moisture loss; moreover recently a link between pollution and pigmentation was also found. All these effects combined accelerate the appearance of fine lines, destroy collagen and elastin and increase the loss of elasticity.

Dr. Giuseppe Valacchi, an associate professor in physiology at the Department of Life Sciences and Biotechnology at the University of Ferrara in Italy said “It’s as if ozone were designed specifically to injure our skin”.

Similarly, Zoe Draelos, M.D., consulting professor of dermatology at Duke University School of Medicine, Durham, N.C. said “I do not think that a lot of people fully understand or appreciate the effects of the nanoparticles that are generated from either internal combustion engines, cigarette smoke or byproducts of industrial processes,”. She added, “The truth is that these can have a profound effect on the skin in terms of premature skin aging, and we as dermatologists need not only to be aware of their action but also appropriately advise our patients in how to best avoid them.”

How to protect your skin?

1. Follow a skincare routine on a daily basis
  • Wash your face with the right cleanser every night.
  • Use beneficial antioxidants: vitamin C and E on your skin. Many cosmetic brands have vitamin C and E products to use on your face skin, which will help repair the loss of elasticity.
  • Use skin barrier repair with a pollution control moisturizer.
2. Adopt a diet that helps skin care from within
  • Increase your intake of kelp, spirulina to help remove heavy metals
  • Increase antioxidants in your diet with berries, peppers, greens, sweet potatoes, carrots, nuts and seeds.
  • Increase consumption of live yoghurt and fermented products like kefir grains. This will help nutrient absorption and make toxin removal more efficie

Adopt healthy habits, protect your skin!